What you measure, you improve. The Indian insurance agents who consistently outperform their peers aren't smarter or more aggressive — they simply look at their numbers more often. Monthly business reports turn an agent's work from intuition-driven into data-driven. This guide walks through the seven essential reports every Indian insurance agency should run monthly, what each report tells you, and how to act on what you see. Whether you handle 100 policies or 3,000, the reports below should be running in your insurance agency management software automatically. Related: Agency Profit & Loss Dashboard, Business Growth Analytics, Monthly Premium Report and Real-Time Renewal Analytics.
Report 1 — Monthly Premium Booked
Your topline revenue indicator. Total premium booked this month, broken down by insurer, product line (motor / health / life / general), and new business vs renewal. Tracks the trajectory of your business at a glance.
What to look for: month-over-month trend (is your book growing, flat, or shrinking?), insurer concentration (are you over-dependent on one company?), product-mix shifts (is your renewal-heavy line growing relative to fresh-acquisition lines?). A working insurance digital assistant app generates this report automatically on the 1st of every month and emails it to you. More on monthly premium reports here.
Report 2 — Renewal Ratio (The Most Important Number)
Of the policies that came up for renewal this month, what percentage actually renewed with you? This single number is the most important metric in your agency. Below 70% indicates serious leakage — customers are switching to competitors or letting policies lapse. 85%+ indicates a healthy retention engine.
Track renewal ratio by product line (motor vs health vs life have different baselines), by sub-agent (which POSP retains best?), and by source (do referral customers renew better than dealer-source customers?). The renewal ratio report drives your renewal strategy more than any other metric. See Renewal Ratio Tracking Tool and Never Miss A Policy Renewal.
Try Agenex Free
Every Agenex feature is included on a free trial — no credit card required. India's insurance agency management software with all 7 reports built in.
Start Free TrialReport 3 — Commission Earnings Split
Total commission earned this month, split between First-Year Commission (FYC) on new business and Renewal Commission on existing book. As your book ages and matures, renewal commission share should naturally grow toward 60-70% of total — meaning you have a stable recurring income base.
If renewal commission share is low (under 30%), your book is too dependent on new acquisition every month. One bad month of acquisition tanks your income. If renewal share is healthy (50%+), you have a more predictable business. Use this report to identify whether to focus your time on new acquisition or on retention deepening for the current quarter. See Commission Tracking Software and Commission Tracking Dashboard.
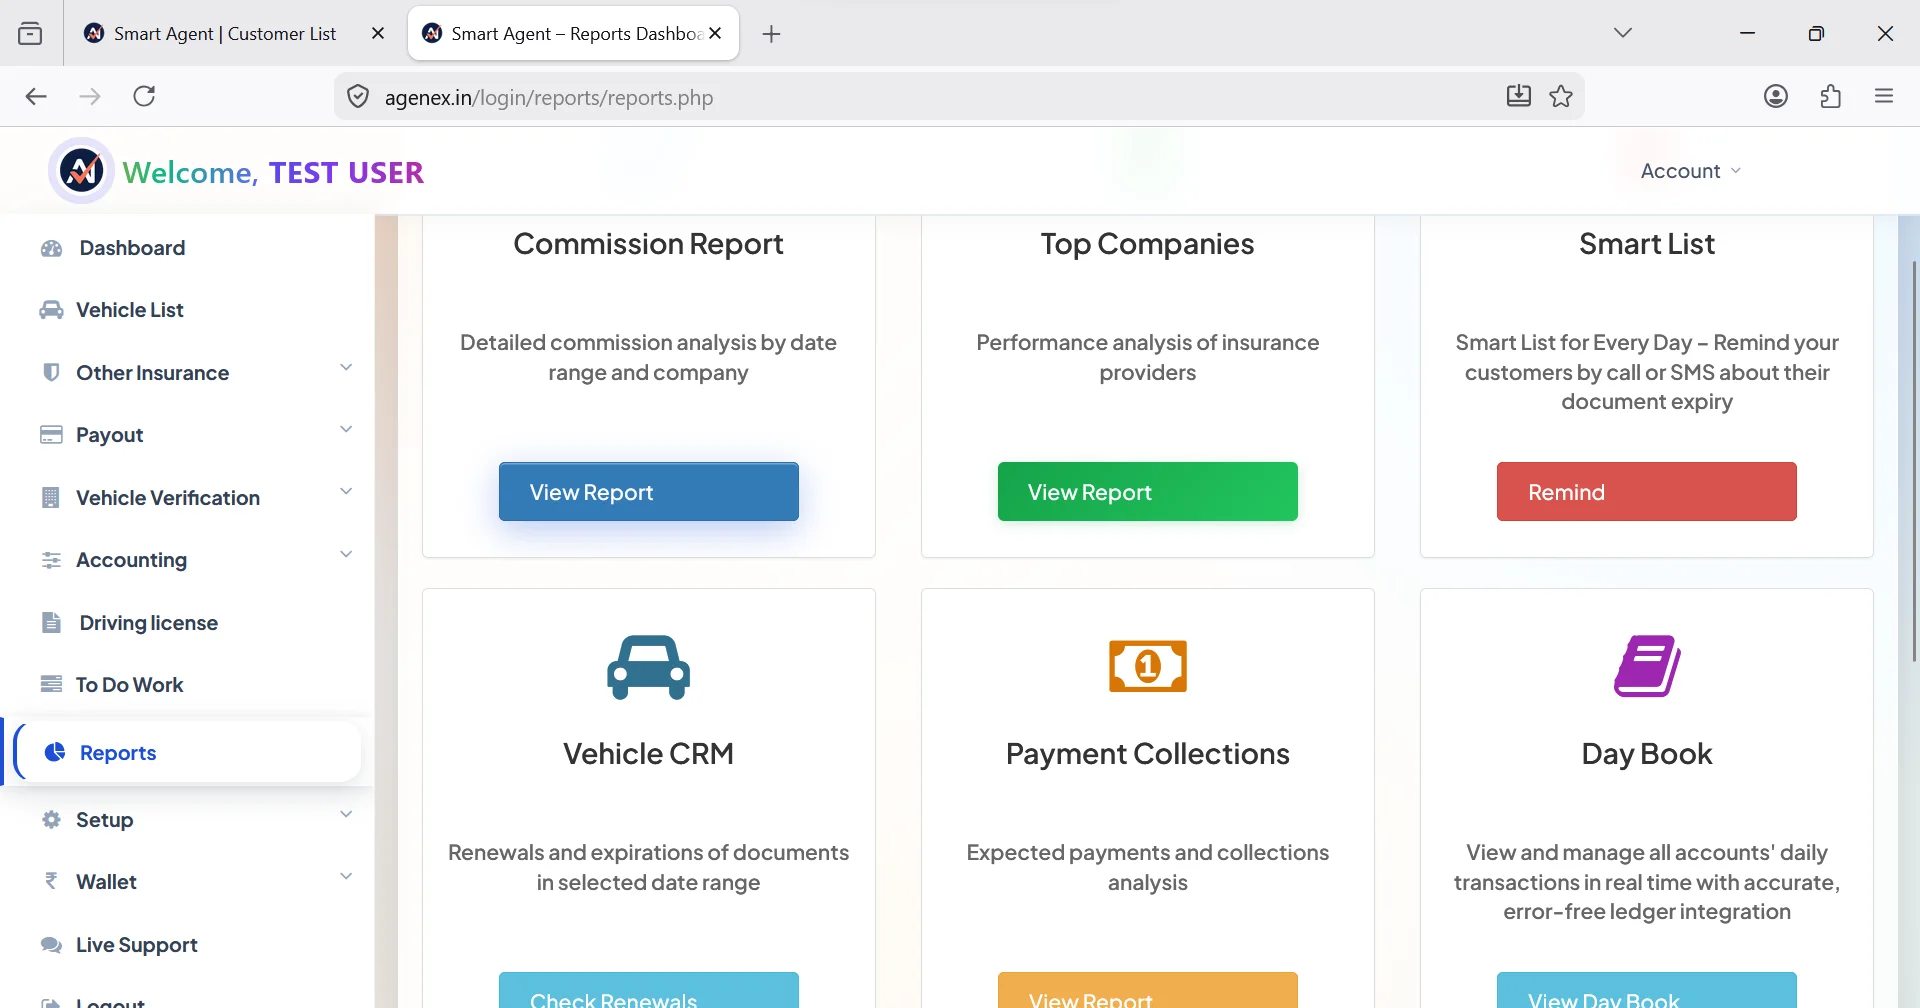
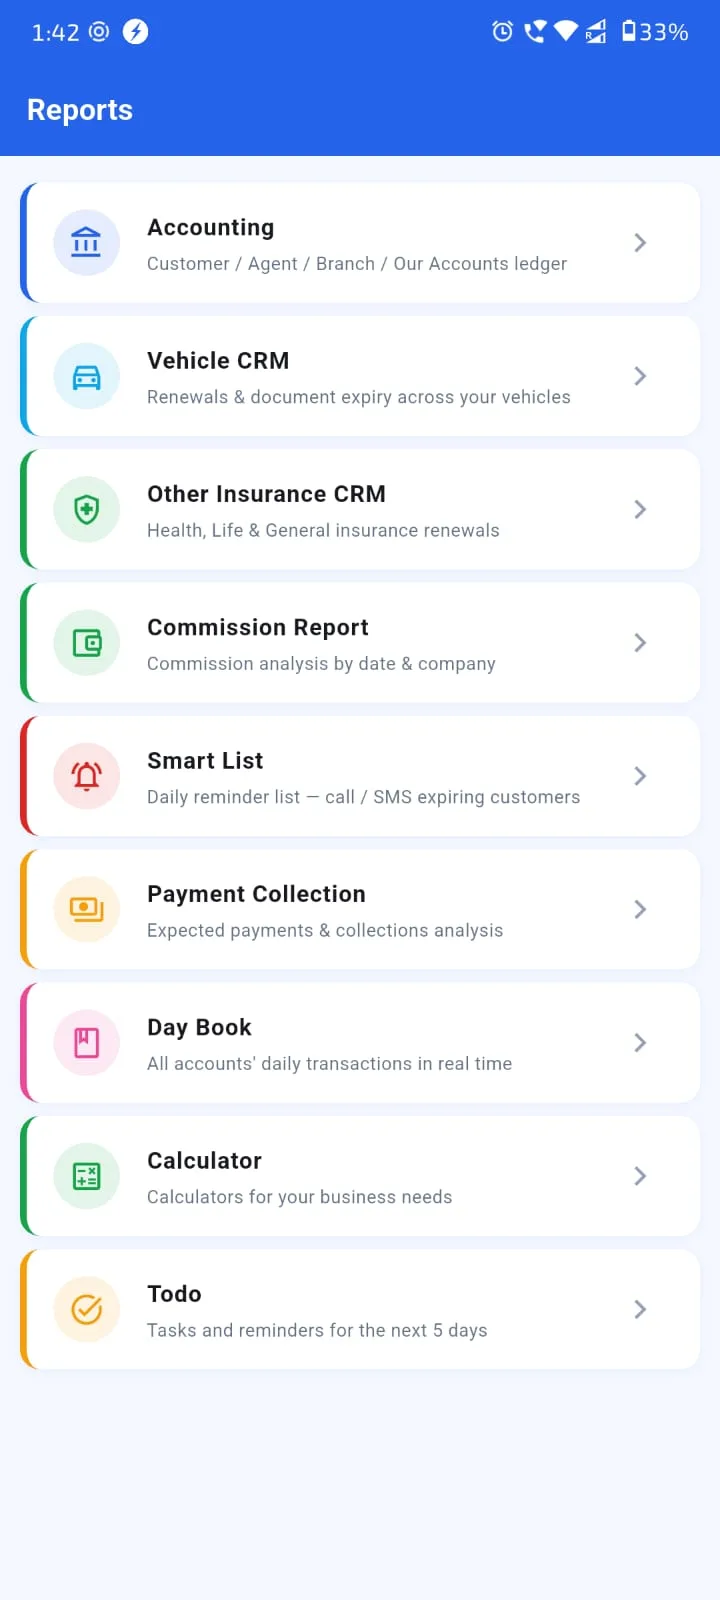
Reports 4-7 — Customer, Lapsed, Sub-Agent, Cross-Sell
Report 4 — Top 20 Customers by Premium: Your highest-value relationships. These customers should get personal attention — call them once a quarter, send personalized greetings, prioritize their renewals. Often 20% of your customers generate 60-70% of your commission.
Report 5 — Lapsed Policies Win-Back List: Policies that lapsed in the last 30, 60, 90 days. These customers are still warm — most lapsed because of forgetfulness or temporary cash flow issues, not because they switched competitors. A targeted win-back campaign typically recovers 15-30% of recent lapses. Use this list, send personalized WhatsApp messages, follow up with calls for high-value ones.
Report 6 — Sub-Agent Performance Scorecard: Each sub-agent / POSP's contribution — policies issued, premium booked, renewal ratio, commission generated. Use this to identify top performers (replicate what works), struggling ones (give support or training), and inactive ones (have a conversation about whether the partnership is still active). Critical for any agency running a PoSP agent registration app network.
Report 7 — Cross-Sell Opportunity List: Customers who have motor but no health, or health but no term, or any other gap. This is your daily call list for cross-sell. The most under-utilized report in most agencies — yet typically the source of the easiest commission growth in any quarter.
How To Act On Reports
Reports without action are just numbers. The discipline that separates top earners is what they do every month with these reports. A practical monthly rhythm: 1st of month, all 7 reports auto-generate and land in your inbox. 2nd-3rd of month, you review them — 30 minutes total, on your phone or laptop. Identify 1-2 actions for the month — e.g., "win back 10 lapsed motor customers" or "cross-sell health to top 20 motor customers without health cover." Execute through your insurance lead tracking system over the next 3 weeks. Repeat.
Most agents who do this consistently for 6 months see meaningful improvement in business metrics — without changing anything else about how they work. The reports don't sell for you. But they show you where to focus, and focus is what compounds. Insurance lead manage kaise kare at scale is fundamentally a measurement-and-iteration discipline, not a creative one.
FAQ
Monthly is the minimum. Quarterly review for strategic patterns. Weekly for renewal ratio and lapsed list specifically — these are operational metrics that need faster reaction.
Yes — PDF for review and Excel for further analysis or sharing with your CA. Tally-compatible exports also available for accounting integration.
Yes — per-sub-agent scorecards with policies booked, premium amount, renewal ratio and commission generated. Each sub-agent can also see their own scorecard via their login.
Run a win-back campaign — personalized WhatsApp messages, follow-up calls for high-value lapses. Typically 15-30% recovery rate within 30 days of the lapse. Use the customer renewal reminder software auto-cadence for grace-period touches too.
Reports auto-generate and land in your inbox even if you don't open them. The system maintains historical reports too — you can review last month or last quarter retroactively.